SNR
Signal-to-Noise Ratio (SNR)
Inputs
- Data: input dataset
Outputs
- Signal-to-noise ratio: signal-to-noise ratio dataset
- SNR = \(\frac{\overline{Spectra_{x, y}}}{\sigma _{x, y}}\)
- Averages: averaged dataset
- Averages = \(\overline{Spectra_{x, y}}\)
- Standard Deviation: standard deviation dataset
- Standard Deviation = \(\sigma _{x, y}\)
The SNR widget computes the SNR, average, or standard deviation of spectra. It can output the results of an entire dataset or by coordinates (x, y).
Use Select axis: x to select an axis that will act as the first element for your coordinate system defined by a numeric meta.
Use Select axis: y to select an axis that will act as the second element for your coordinate system defined by a numeric meta.
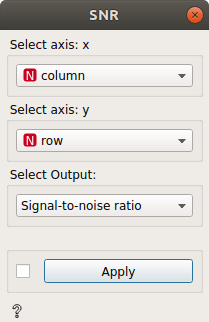
In the example above, the result will be:
output = Signal-to-noise ratio(column, row)
SNR = \(\frac{\overline{Spectra_{column, row}}}{\sigma _{column, row}}\)
If you want to select only one axis:
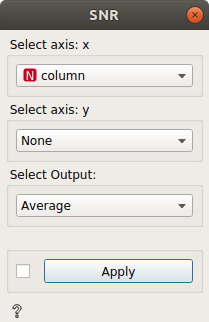
output = Average(x)
Average = \(\overline{Spectra_{column}}\)
or
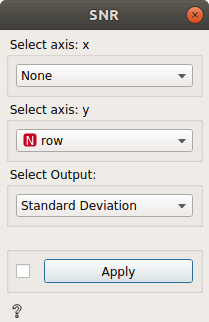
output = Standard Deviation(x)
Standard Deviation = \(\sigma _{column}\)
If you want the result of the complete data set, you can just leave both as None.