Align Datasets
Alignment of multiple datasets with a diagram of correlation visualization.
Inputs
- Data: single cell dataset
Outputs
- Transformed Data: aligned data
- Genes per n. Components
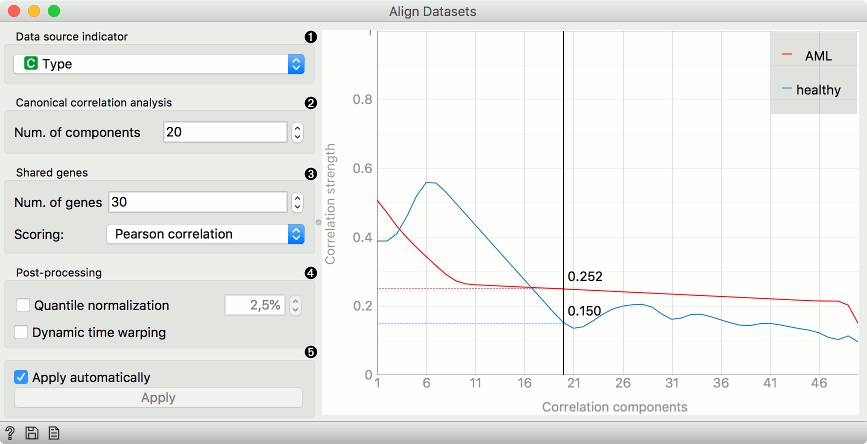
- Data source indicator
- Number of components for canonical correlation analysis.
- Number of shared genes and the scoring method for alignment. Scoring can be done with Pearson, Spearman and Biweights midcorrelation.
- Tick the box to use the percent of quantile normalization and dynamic time warping.
- If Apply automatically is ticked, the results will be communicated automatically. Alternatively, press Apply.